Stock_Heatmap_Visualization
Visualization of given stock performance by months
Output 1 Example:
Output 2 Example:
Output 3 Example:
Stock Performance Analyzer
This project utilizes Yahoo Finance data to analyze the performance of a given stock (in this example, TUPRS). The analysis includes:
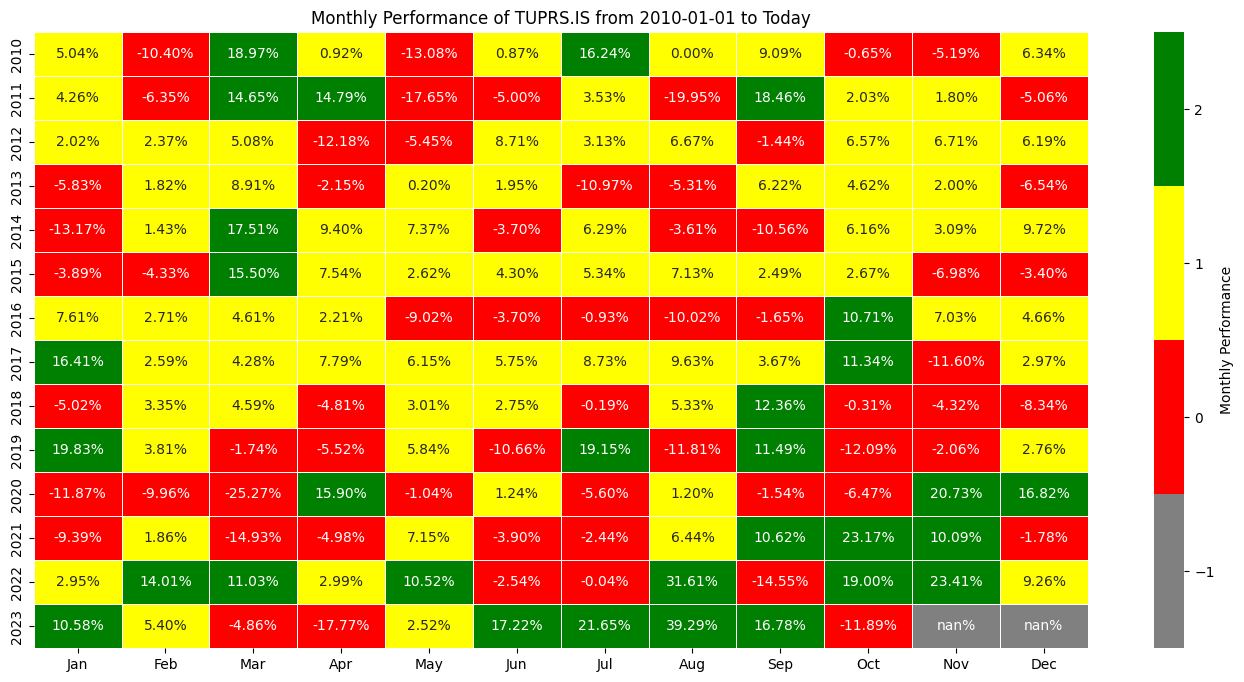
- A heatmap representing the stock's monthly performance.
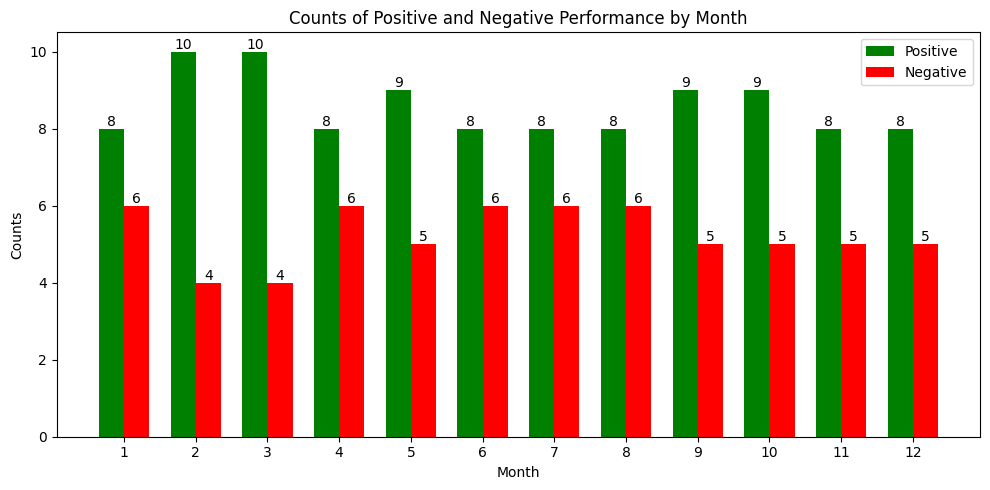
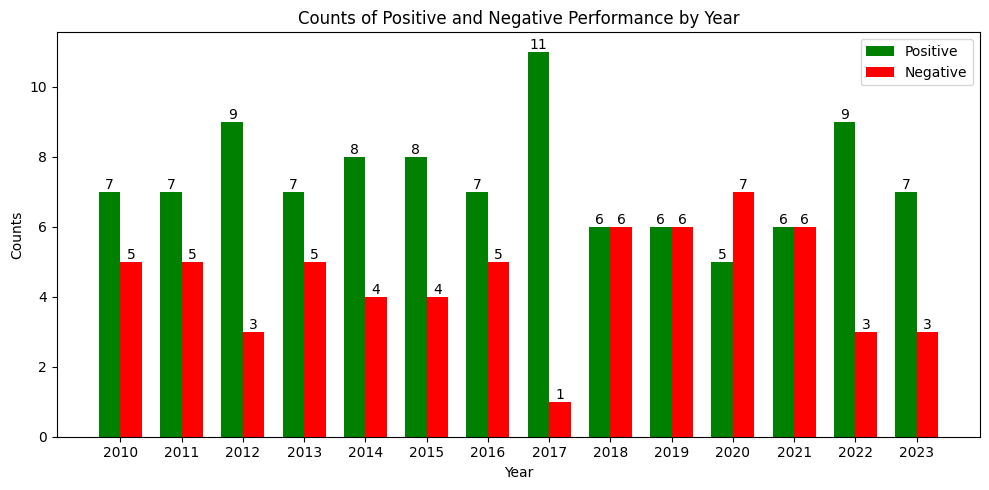
- Monthly and yearly histograms illustrating positive and negative performance counts.
Let's Explain Each Codeblock:
1. Import Section
This block imports necessary libraries and modules for data fetching, analysis, and visualization.
2. StockPerformanceAnalyzer Class Definition
StockPerformanceAnalyzer class provides tools to analyze the monthly and yearly performance of a given stock.
3. Initializer
Initializes an instance of the StockPerformanceAnalyzer class with a stock symbol and start date. It also fetches and preprocesses stock performance data.
4. Heatmap Visualization
Plots a heatmap showcasing the monthly performance of the stock over years, with performance values color-coded.
5. Histogram Visualization for Monthly and Yearly Data
These methods generate histogram plots to display the number of positive and negative performance months/years for the stock.
6. Helper Functions
These methods generate histogram plots to display the number of positive and negative performance months/years for the stock.
7. Main Execution Block
The main execution block where an instance of the StockPerformanceAnalyzer class is created for the stock symbol "TUPRS.IS" starting from "2010-01-01". The program then calls methods to visualize the stock's monthly and yearly performance.
The Output:
Heatmap:
Monthly Histogram:
Yearly Histogram:
Overall Insights
1 - Seasonality in Monthly Performance
- 2017 and 2022 were favorable years, showing strong positive cumulative performances.
2 - Yearly Performance Highlights:
- February and March are most likely to have positive returns, indicating that there is seasonality in the first quarter.
3 - General Observations:
- The stock shows a mix of both positive and negative months throughout the years, indicating the importance of a diversified investment strategy and consistent monitoring.
- There are potential seasonal patterns in the stock's performance, which investors could explore further to optimize their trading strategies.
Further Analysis
- Event Analysis: Should investigate specific events, company news, or industry trends during the notable years to understand the factors influencing the stock's performance.
- Economic Conditions: Should correlate the stock's performance with broader economic indicators or global events, especially for years with significant downturns or upturns.
- Peer Comparison: Should compare the stock's performance with its industry peers to understand if the trends are company-specific or industry-wide.